The community outreach process included conducting surveys, polls, focus groups, meetings, interviews, and project briefings, as well as, receiving comments via email or through the GoDigitalMarin website. A list of organizations that participated in focus groups and meetings is available under the Communities section.
Participation
Overall, Community outreach resulted in conducting 12 surveys and more than 47 focus groups, meetings, briefings, and interviews. In total, more than 2,700 touch points occurred, including participating on the ESC or in Community Work Groups, responding to surveys and polls, attending focus groups, meetings, interviews, or project briefings, and providing comments via email or the GoDigitalMarin website.
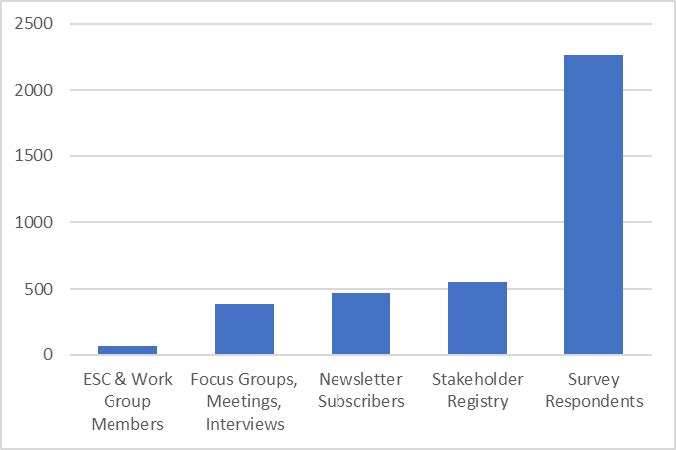
In addition, nearly 550 people are part of the project’s Stakeholder Register (SHR) and over 460 people subscribe to Digital Marin’s weekly email newsletter, bringing the total to over 3,700. These interactions are called touch points since in some cases, an individual participated in more than one activity.
Surveys
In addition to the standard Online Residents and Online Business Surveys hosted by the project’s consultants, Magellan Advisors, six (6) targeted surveys for under-represented stakeholders were conducted by the Digital Marin project. Additionally, results of available community surveys and studies were reviewed and are referenced throughout this Report.
| Community | Survey name / target audience |
| Business and economic development | Standard online business survey |
| Education | Countywide education survey |
| Health and community based organizations | Health and human services survey
Community based organizations survey |
| Residents | Standard online residents survey
Golden Gate Regional Center survey Marin City survey Marin Housing Authority Residents survey |
Focus groups
Focus Groups were conducted by one to three members of Digital Marin’s ESC and project team using questions that were prepared in advance. These meetings were not recorded to allow participants to speak candidly about problems and issues as well as needs. Minutes were taken and used in aggregate to inform the needs assessment findings. The list of groups and organizations participating in focus groups and the presentations from these meetings are posted at under the Communities section. A follow up survey consisting of the same questions asked at the focus group meeting was sent to all members of each group so that people who did not attend or attendees with additional comments could share information for inclusion in the process.
Other – Meetings, Interviews, and Comments
Digital Marin’s ESC and project team members conducted individual and small group interviews. Notes were taken and considered as part of the needs assessment. ESC and project team members also presented at various community meetings where polls were conducted and participants were asked to make comments and/or ask questions about the project. Needs were captured from each of these meetings. Additional needs were provided to the project team via the comment function on the GoDigitalMarin website and through direct email. This information was also considered as part of the needs assessment process.
Demographics
The methods used to collect data during the project’s needs assessment phase were solely for the purpose of identifying needs from the largest possible number of Marin’s residents and businesses. The assessment was not conducted using a formal research methodology. As such, limited demographic data was collected. Digital Marin strongly recommends that projects which continue or emerge as a result of the needs assessment include collection of detailed demographic data. Following is the demographic data that was collected.
Residents accounted for slightly more than half of the participants (54%), followed by the Education Community, which included a large number of students. The Business Community’s participation was less than desired, due in large part to timing. Businesses were challenged by the COVID pandemic during the needs assessment period. Digital Marin recommends that additional assessment of the Business Community’s digital needs be conducted as part of the development of a Marin County Economic Strategy.
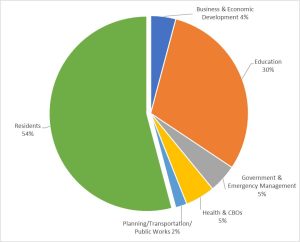
While the participation rates for the GEM, PTPW, and H/CBO Communities appear low, participants represented organizations, not individuals. Representation from organizations within these Communities was high with the exception of non-profits/CBO, which had lower than desired representation. Digital Marin recommends that additional assessment be done for non-profits/CBO when they are included in digital projects.
Providing location information was not mandatory for participation in surveys, focus groups, interviews, and other forms of data collection. Location information was collected for slightly more than half of the 3,700+ touch points (53%). The following graph shows the breakdown by location where data was collected.
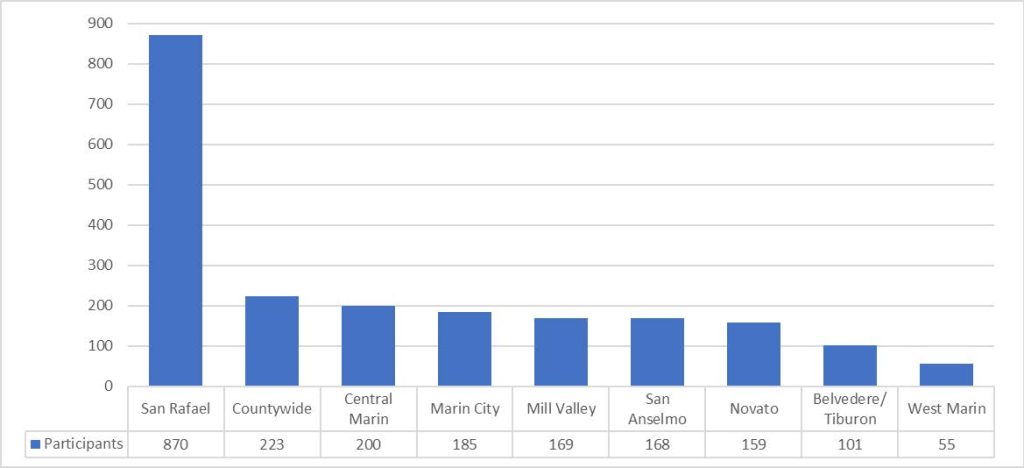
For the purpose of the above graph:
- San Rafael includes the Canal Neighborhood for participants in the Digital Marin project’s surveys;
- Countywide represents participation by a person who individually or through their role in an organization provides services throughout Marin;
- Central Marin includes Corte Madera, Fairfax, Greenbrae, Larkspur, Ross, Sausalito, and Woodacre; and
- West Marin includes Tomales, Bolinas, Nicasio, Stinson Beach, Point Reyes, and other communities in that geographic region.
Although their findings were considered as part of the needs assessment process, the location graph does not include data from surveys conducted by other organizations such as the City of San Rafael in the Canal Neighborhood, the Bolinas Stinson Union School District, or as part of other studies and surveys referenced throughout the Report.
Unfortunately, Digital Marin’s outreach in the Canal Neighborhood did not generate enough responses with location data to be statistically significant on its own. Luckily, the survey conducted by the City of San Rafael in the Canal Neighborhood generated a large number of responses for that Community (849). Digital Marin’s targeted efforts in West Marin did not generate many responses. Additionally, despite several attempts to identify the two un- or underserved communities in Novato, the project team was unable to obtain enough information to identify them. Digital Marin recommends that additional assessment efforts be conducted in West Marin and the two un- or underserved areas in Novato.
The standard Online Residents Survey generated more responses than all the other Digital Marin surveys combined. When compared with U.S. Census Bureau data (V2019) for Marin County, ORS respondents and their households skewed to older, highly educated occupants, who live in a home they own, with a 50% chance that it is located in San Rafael, Mill Valley, or San Anselmo. The Marin Housing Authority assisted with a survey of residents in Golden Gate Village in Marin City. Based on the World Population Review’s 2021 estimates using U.S. Census Bureau data, Marin City survey respondents and their households were most likely younger, with a lower level of higher education, living in rental housing.
| Demographic | ORS respondents | Marin City | Marin County |
| Owner occupied homes | 72.9% | 26.7% | 63.7% |
| Average household size | 2.2 people | 2.3 people | 2.4 people |
| Persons 65 years or older | 54% | 14.3% | 23% |
| Persons under 18 years | 20.8% | 27.8% | 19.8% |
| Bachelor's degree or higher | 88.3% | 39.3% | 59.5% |
| In the workforce | 64.6% | 64.5% | 63.7% |