Despite its relative wealth and location near San Francisco, a major technology hub, Marin still has residents who suffer from the digital divide - the economic, educational, and social inequalities between those who have computers and online access and those who do not have it. While many of these residents are concentrated in the five (5) geographic areas noted below, lack of access to affordable, reliable high-speed internet is not limited to these areas and is found throughout Marin County.
- Canal Neighborhood in San Rafael
- Marin City
- Two areas in Novato
- West Marin
These five geographic areas are also designated as un- or underserved in terms of broadband service. Collaborations to bridge aspects of the digital divide are already underway in three (3) of these areas – the Canal Neighborhood, Marin City, and West Marin. As noted in the Residents Community section of this Report, more work is needed to identify the two underserved areas in Novato along with the community advocates necessary to lead collaborative efforts.
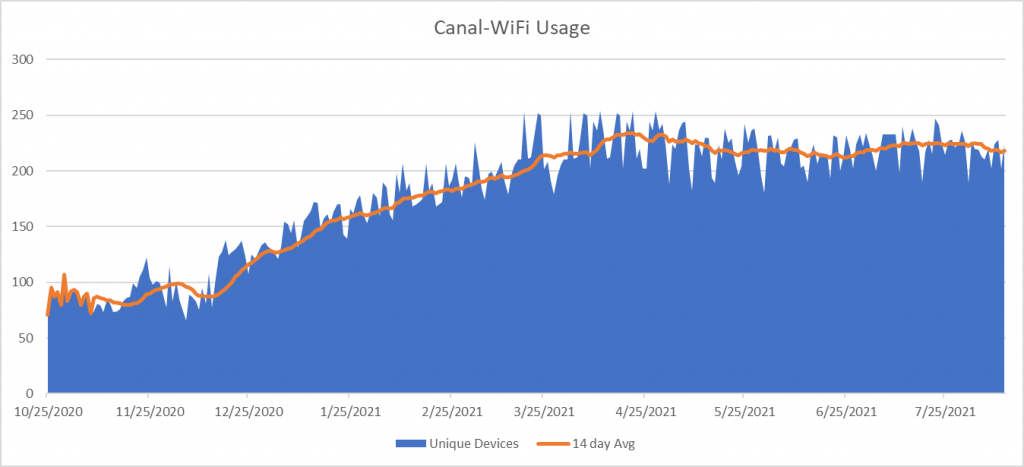
For example, the City of San Rafael, County of Marin, Canal Alliance, and San Rafael City Schools teamed up to build a free and public Wi-Fi network for the Canal Neighborhood during the pandemic. Designed with resiliency in mind, generators keep parts of the network up during major power outages, allowing residents to access critical emergency information when home internet connectivity may be down. Usage has steadily increased since it was first deployed in late October 2020.
More information about this collaboration and others can be found on the Collaborations page.
The needs assessment also identified another group of residents who frequently experience the digital divide - Marin’s older adults and people with disabilities. People in these groups are not geographically concentrated. Instead, they are dispersed throughout Marin. Even when service is available and affordable, these residents often face other challenges and require intentional, targeted efforts to help them bridge the digital divide. Without these efforts, more than 12,900 Marin residents with disabilities under age 65 and nearly 60,000 residents 65 years old and older can be shut out of the increasingly digital world. Population estimates are based on U.S. Census Bureau data (V2019) for Marin County.
Marin's Device Disparity
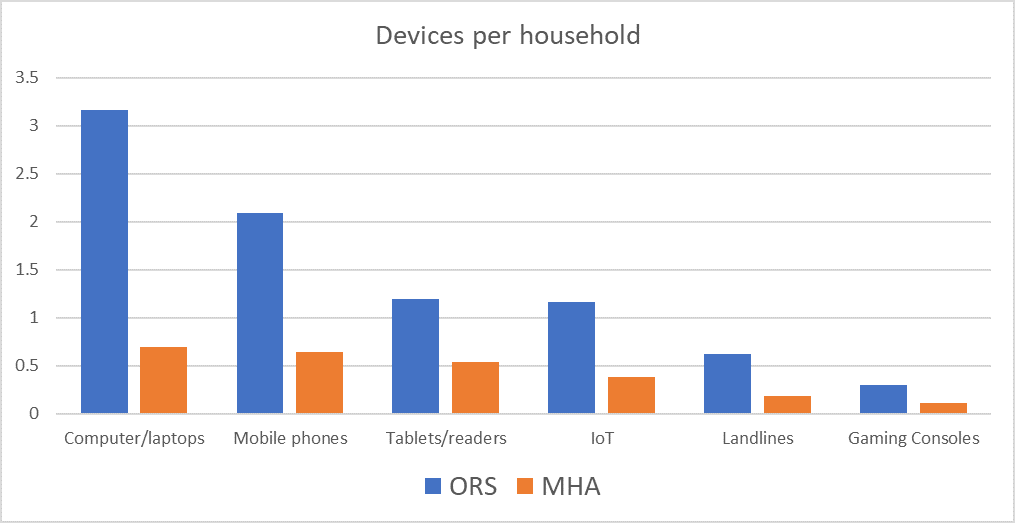
The needs assessment findings highlight the device disparity among Marin’s residents and businesses. When asked what devices were connected to their home internet service, 678 respondents to the standard ORS reported a total of nearly 5,800 devices; 8.5 per household. In contrast, 173 respondents to a survey conducted of residents in Marin Housing Authority (MHA) subsidized housing reported a total of 443 devices; 2.6 per household. A 2020 study regarding consumer electronics found that U.S. households on average have 10 connected devices.
In both cases, some of the differences between the project’s survey findings and the U.S. study may be caused by under-reporting, especially of Internet of Things (IoT) devices, like security systems, sensors, personal assistants, and other smart devices. Even with more accurate counts of devices by MHA survey respondents, the average per household would likely still fall
well short of even 8.5 devices.
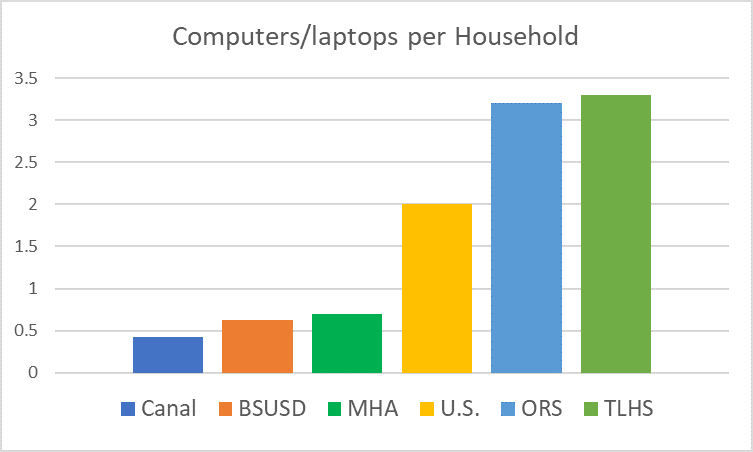
The same 2020 study found that the average U.S. household has two computers. When comparing computers/laptops per household in Marin, survey respondents reported a range of less than one half (.4) per household in the Canal Neighborhood through 3.3 per household for students at Terra Linda High School in San Rafael.
This data in the above chart is based on the following survey sources.
- Canal neighborhood (Canal) survey conducted by the City of San Rafael
- Bolinas Stinson Union School District (BSUSD) Connectivity Committee Survey
- Marin Housing Authority (MHA) Residents Survey conducted by the Digital Marin project
- Online Residents Survey (ORS) hosted by Magellan Advisors and conducted by the Digital Marin project
- Terra Linda High School (TLHS) Student Survey conducted by students at the Marin Academy